![]()
![]()
![]()
![]()
![]()
![]()
![]()
![]()
![]()
![]()
![]()
![]()
![]()
![]()
![]()
![]()
![]()
![]()
![]()
![]()


There are loads of ways that you can use Excel in Geography. Here are a four examples:
1. Pollsters
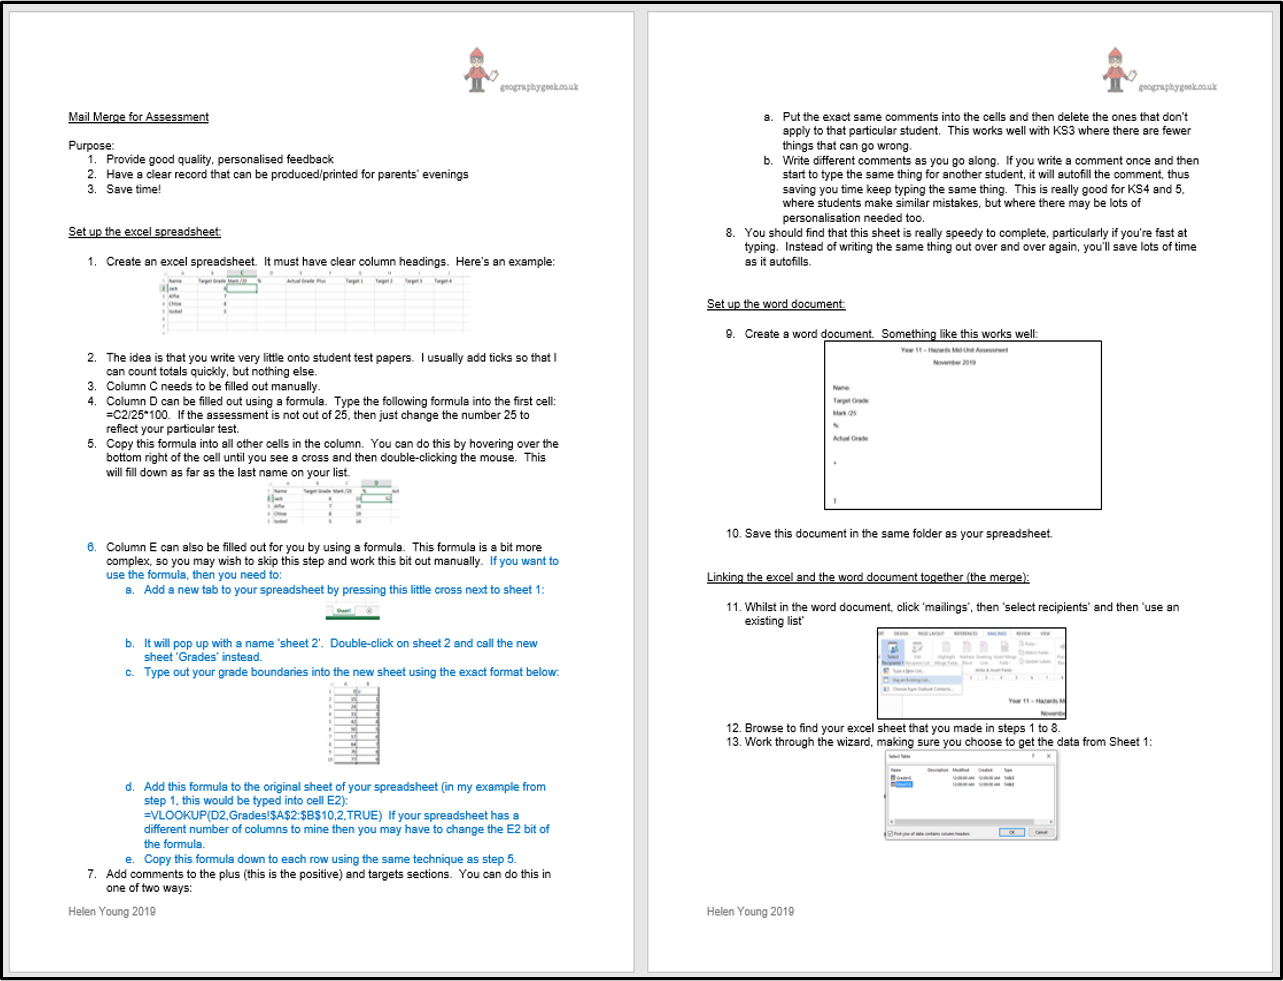
2. Mail Merge for Assessment Feedback
3. Personalised Learning Targets
1. Pollsters (click the image below to download the pollster). I can't claim that this is my idea, but I'm not sure where I originally saw it so I can't credit anyone else either. I make loads of Pollster sheets as they're a good background activity for use in class. You can type pretty much anything into the sheet and then carry out a poll during the lesson. I have pollsters for all occasions available on TES.
 |
|
2. Mail Merge for Assessment Feedback (click the image below to download the help sheet). A really useful technique for fast, personalised marking and feedback.
 |
3. Personalised Learning Targets Personalised learning targets are really easy to set up. Most people create targets for students when they mark exam papers anyway, so why not make use of them?
Click here to see an example. The student names have been replaced with generic student numbers. The Excel spreadsheet contains a whole range of data about each student. The Word document contains a frame to make the data easier to understand. You then need to do a mailmerge in Word to link the data. It is unlikely that this file will download with the mailmerge still in place, but it can easily be re-linked.
This is such an easy thing to do and it has a huge effect on results. Students know exactly what they need to do and parents appreciate the depth of information available to them.
4. Gameshow Geography (click the image below to download the gameshow file). I made this scoreboard for use with classes doing end of term quizzes. The classes get much more involved in the activity as they can follow the scores better. You can type individual team names into this spreadsheet and they will appear under the graph. I've also put a countdown timer in the top right of the screen for authentic gameshow effect!
